Fluorescence
Lifetime Measurements
 Measurements
of a fluorescent molecule’s emission time after being exposed to a brief flash
of light can yield information about a system above and beyond standard fluorescence
intensity measurements. The photons are emitted at statistically random times,
resulting in an exponentially decaying curve. The time it takes for 63% of the
population to emit is referred to as the fluorescence lifetime. Most
fluorescent dyes used in biological research have lifetimes on the order of
less than a nanosecond to tens of nanoseconds depending on the fluorophore and
its environment. This lifetime scale is comparable to the time scale of many
types of molecular motions and makes probing these motions possible.
Measurements
of a fluorescent molecule’s emission time after being exposed to a brief flash
of light can yield information about a system above and beyond standard fluorescence
intensity measurements. The photons are emitted at statistically random times,
resulting in an exponentially decaying curve. The time it takes for 63% of the
population to emit is referred to as the fluorescence lifetime. Most
fluorescent dyes used in biological research have lifetimes on the order of
less than a nanosecond to tens of nanoseconds depending on the fluorophore and
its environment. This lifetime scale is comparable to the time scale of many
types of molecular motions and makes probing these motions possible.
The measurements can also be extended to systems involving two fluorophores, each emitting light at different wavelengths. If one of the fluorophores (the “acceptor”) can be excited by the photons emitted by the other fluorophore (the “donor”), the amount of energy transferred will depend on how close they are to each other. This phenomenon, known as Fluorescence Resonance Energy Transfer (FRET), can therefore be used to measure the donor-acceptor distance within or between molecules. The donor's fluorescent lifetime decreases with increasing FRET. In a lifetime experiment if there is not one, but a range of donor-acceptor distances among the molecules in a sample, or the distance is changing due to molecular motion, there will be many different individual fluorescence lifetimes and the range of distances can be determined from deviations in the exponential decay curve.
Another type of fluorescent lifetime experiment involves the measurement of both horizontal and vertical components of fluorophore emission by using polarizers. If the fluorophore is excited by light that is vertically polarized, comparison of the amounts of horizontally and vertically detected emission indicate how much the molecule rotated before the decay occurred. Since rotation rates are slower for bigger molecules (assuming they are spherical), this anisotropy measurement can indicate changes in the size of a molecule due to its unfolding or its binding to another molecule. If the anisotropy is calculated throughout the emission decay time, the resultant anisotropy lifetime can distinguish between rotation of a spherical molecule and other factors that influence the anisotropy, such as the fluorophore moving independently of the rest of the molecule or the molecule being other than spherical.
The
Measurement System
There are three widely-used methods for measuring fluorescence lifetimes; time-domain, frequency domain, and streak cameras. Our system uses the time-domain method, better known as Time Correlated Single Photon Counting (TCSPC). The sample is flashed many times by a very short duration light source, and the time interval between the excitation flash and the first emitted photon is noted each time. Plotting the number of occurrences of a given arrival time versus time as a histogram yields a decay curve. This curve can then be fitted to an exponential (usually multi-exponential for biological systems) model which yields the fluorescence lifetime(s). Since the times in question are so short compared to detector response times (and light source pulse duration for some sources), the curve fitting software must take into account the response characteristic of the system (known as the Instrument Response Function, or IRF). The measured decay curve is mathematically a convolution of the IRF and the true decay curve.
Our measurement system consists of a femtosecond-pulse Titanium Sapphire pulsed laser light source (shown in the top photo on this page), a custom sample compartment with motorized filter wheel and motorized polarizer, and PC cards containing all the TCSPC electronics and motor electronics. Follow the links below for more details on the instrument components.
We have also used a number of
commercially available software packages for curve fitting and analysis. Follow
the link below for more details on these as well as some Labview routines for
importing data into these packages.
An Example Lifetime Measurement
2-Aminopurine
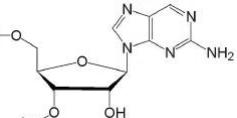
2-Aminopurine Riboside
2-Aminopurine (2-AP) is a
fluorescent nucleotide base analog of adenine and can be chemically
incorporated into DNA or RNA. Unlike other fluorescent compounds used for
biological studies, 2-AP does not have a bulky dye group and can incorporate
into nucleic acid duplexes. The base is quenched (leading to a shorter
fluorescent lifetime) when stacked with other bases but becomes highly
fluorescent (with a longer fluorescent lifetime) when projected out into
solution. In lifetime experiments it can be used as a reporter of conformation
and dynamic motion of the base under various experimental conditions.
Measuring 2-Aminopurine lifetimes is
not without its difficulties. Its absorbance maximum of 307nm does not fall into
the realm of currently available pulsed light sources based on laser diodes or
LEDs. Flash lamps can be used but have limitations of low pulse repetition
rates and relatively high pulse widths. Another option is to optically generate
the third harmonic from an infrared Ti-Sapph mode-locked oscillator, but this
leads to another of 2-AP's properties that creates difficulties: The lifetime
of free 2-AP in solution (not quenched) is roughly 11ns--very close to the
pulse repetition rate of Ti-Sapph cavities. Consequently only about 2/3 of the
dye molecules have completely decayed before the next excitation pulse arrives,
resulting in an artifact in the decay curve and difficulties in data fitting.
Our solution is to lower the pulse repetition rate using an acousto-optic pulse
picker before third harmonic generation. Third harmonic generation is a
terribly inefficient process that depends on the pulse peak intensity cubed,
and thus losses through the pulse picker and associated mirrors drastically
lower the amount of excitation light available for the sample. Typically in
TCSPC experiments some of the excitation light is diverted to the
"stop" detector, further reducing the available sample power.
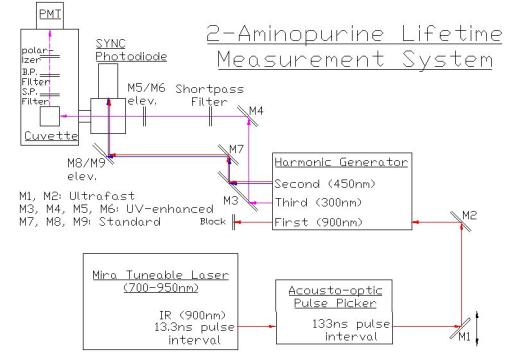
Our lab has overcome these
difficulties in 2-AP measurement by using the optical setup below. The
"stop" detector signal is instead derived from the second harmonic
via a separate pathway. All mirrors before the harmonic generator are of the
"ultrafast" type to preserve peak intensity, and all third harmonic
pathway mirrors are of the "UV-enhanced" type. With this setup and
pulse picking at 1/10th the laser rate, the photon emission rate from 200 nM
2-AP (free dye) exceeds 1% of the repetition rate, while bleed-through of
adjacent laser pulses in the UV pathway is
less than 1.5%.
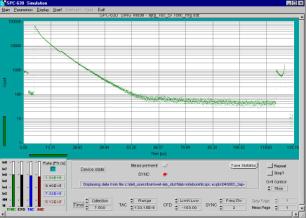
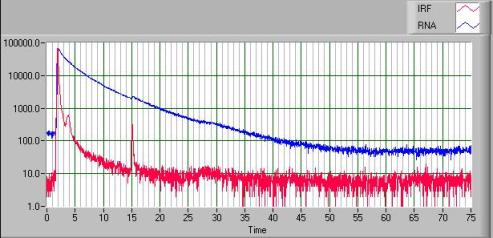
Below is an example of a 2-AP decay
in the context of an RNA hairpin loop. The data can be fit to a
multi-exponential model and indicates multiple conformations of the 2-AP base
exist in this molecule under these conditions. The lower curve is the
instrument response function. The peak 13ns after the main peak is due to
bleedthrough of the N+1 laser pulse.
Last updated August
10, 2003